Full analysis is here
Published in Plant Disease Management Reports 2011, and 2012.
During my master’s degree, we set out a lot of projects (I had originally intended for my master’s to be a PhD…but thats a story for another time). So I ended up having a ton of different interconnected projects running with Doug Gubler looking at different aspects of grape powdery mildew biology and epidemiology. While we knew that there were differences in how grape varieties and cultivars reacted to powdery mildew, we couldn’t find a great resource that looked at the cultivars grown in California in the present. There was a grape vineyard planted in Round Mountain (near Mount Shasta, waaaay up north) that had 10 varieties all grown in a randomized complete block design and were being used by a great grower named Hans Heinrich. Hans was kind and generous enough to let us use his vineyard and equipment to do research, so we sprayed the interior of his vineyard and left the ends of the rows (which contained copies of the varieties) to rate. We rated the vineyard for two years (2011 and 2012) and by the time the second year came up, we knew that I would be transitioning to another lab. We still wanted to get the data together, so we continued to rate the disease and planned on putting together a small manuscript describing our work.
We ended up publishing the results of the trials in two separate PDMR documents. Retrospectively, I wish we had published the work in Plant Health Progress. The story was really interesting, and we had a ton of data, both in time and across quite a few varieties. I think it would have fit better in that journal than as two separate reports. However, whats done is done, and PHP wasn’t quite as prominent then as it is even now.
The Results
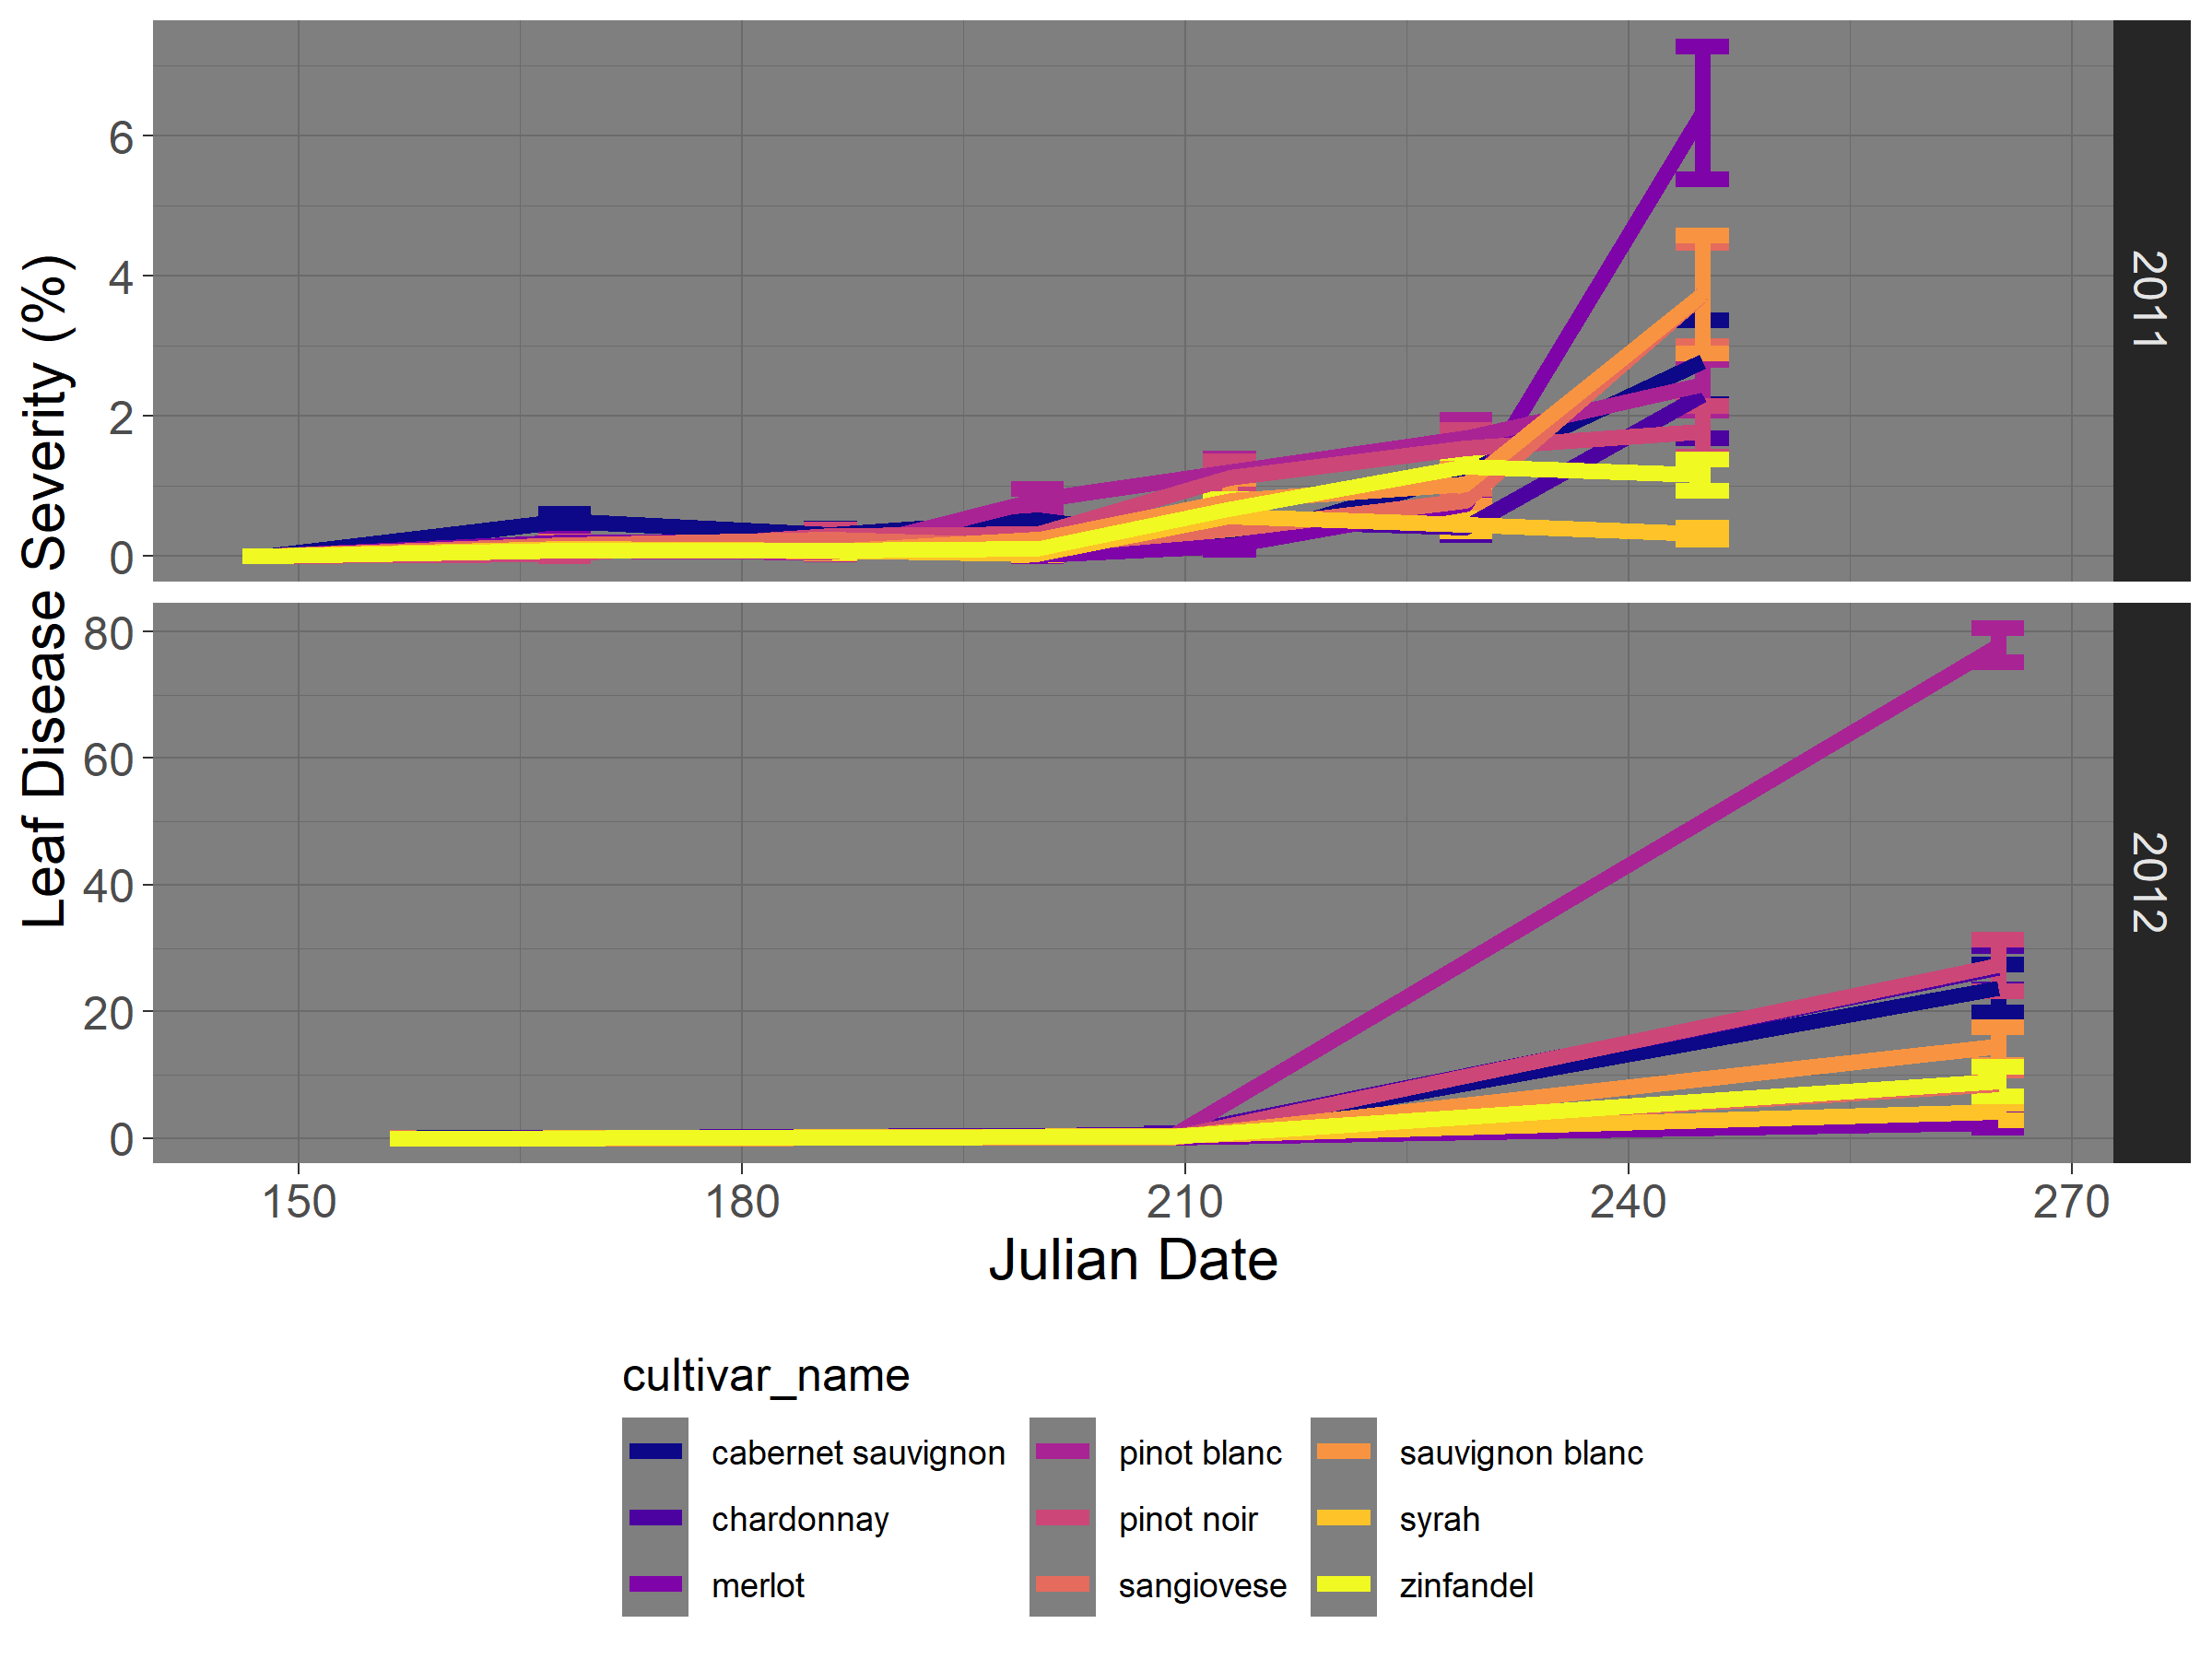 Overall, the results for leaf severity differed slightly between years. In 2011, Merlot had the highest severity, especially towards the end of the season when the severity jumped quite a bit between the final two time points. We rated a little bit later in 2012, and Merlot actually came out near the bottom. Its important to note the scales: Disease severity across the board was waay higher in 2012 for this vineyard.
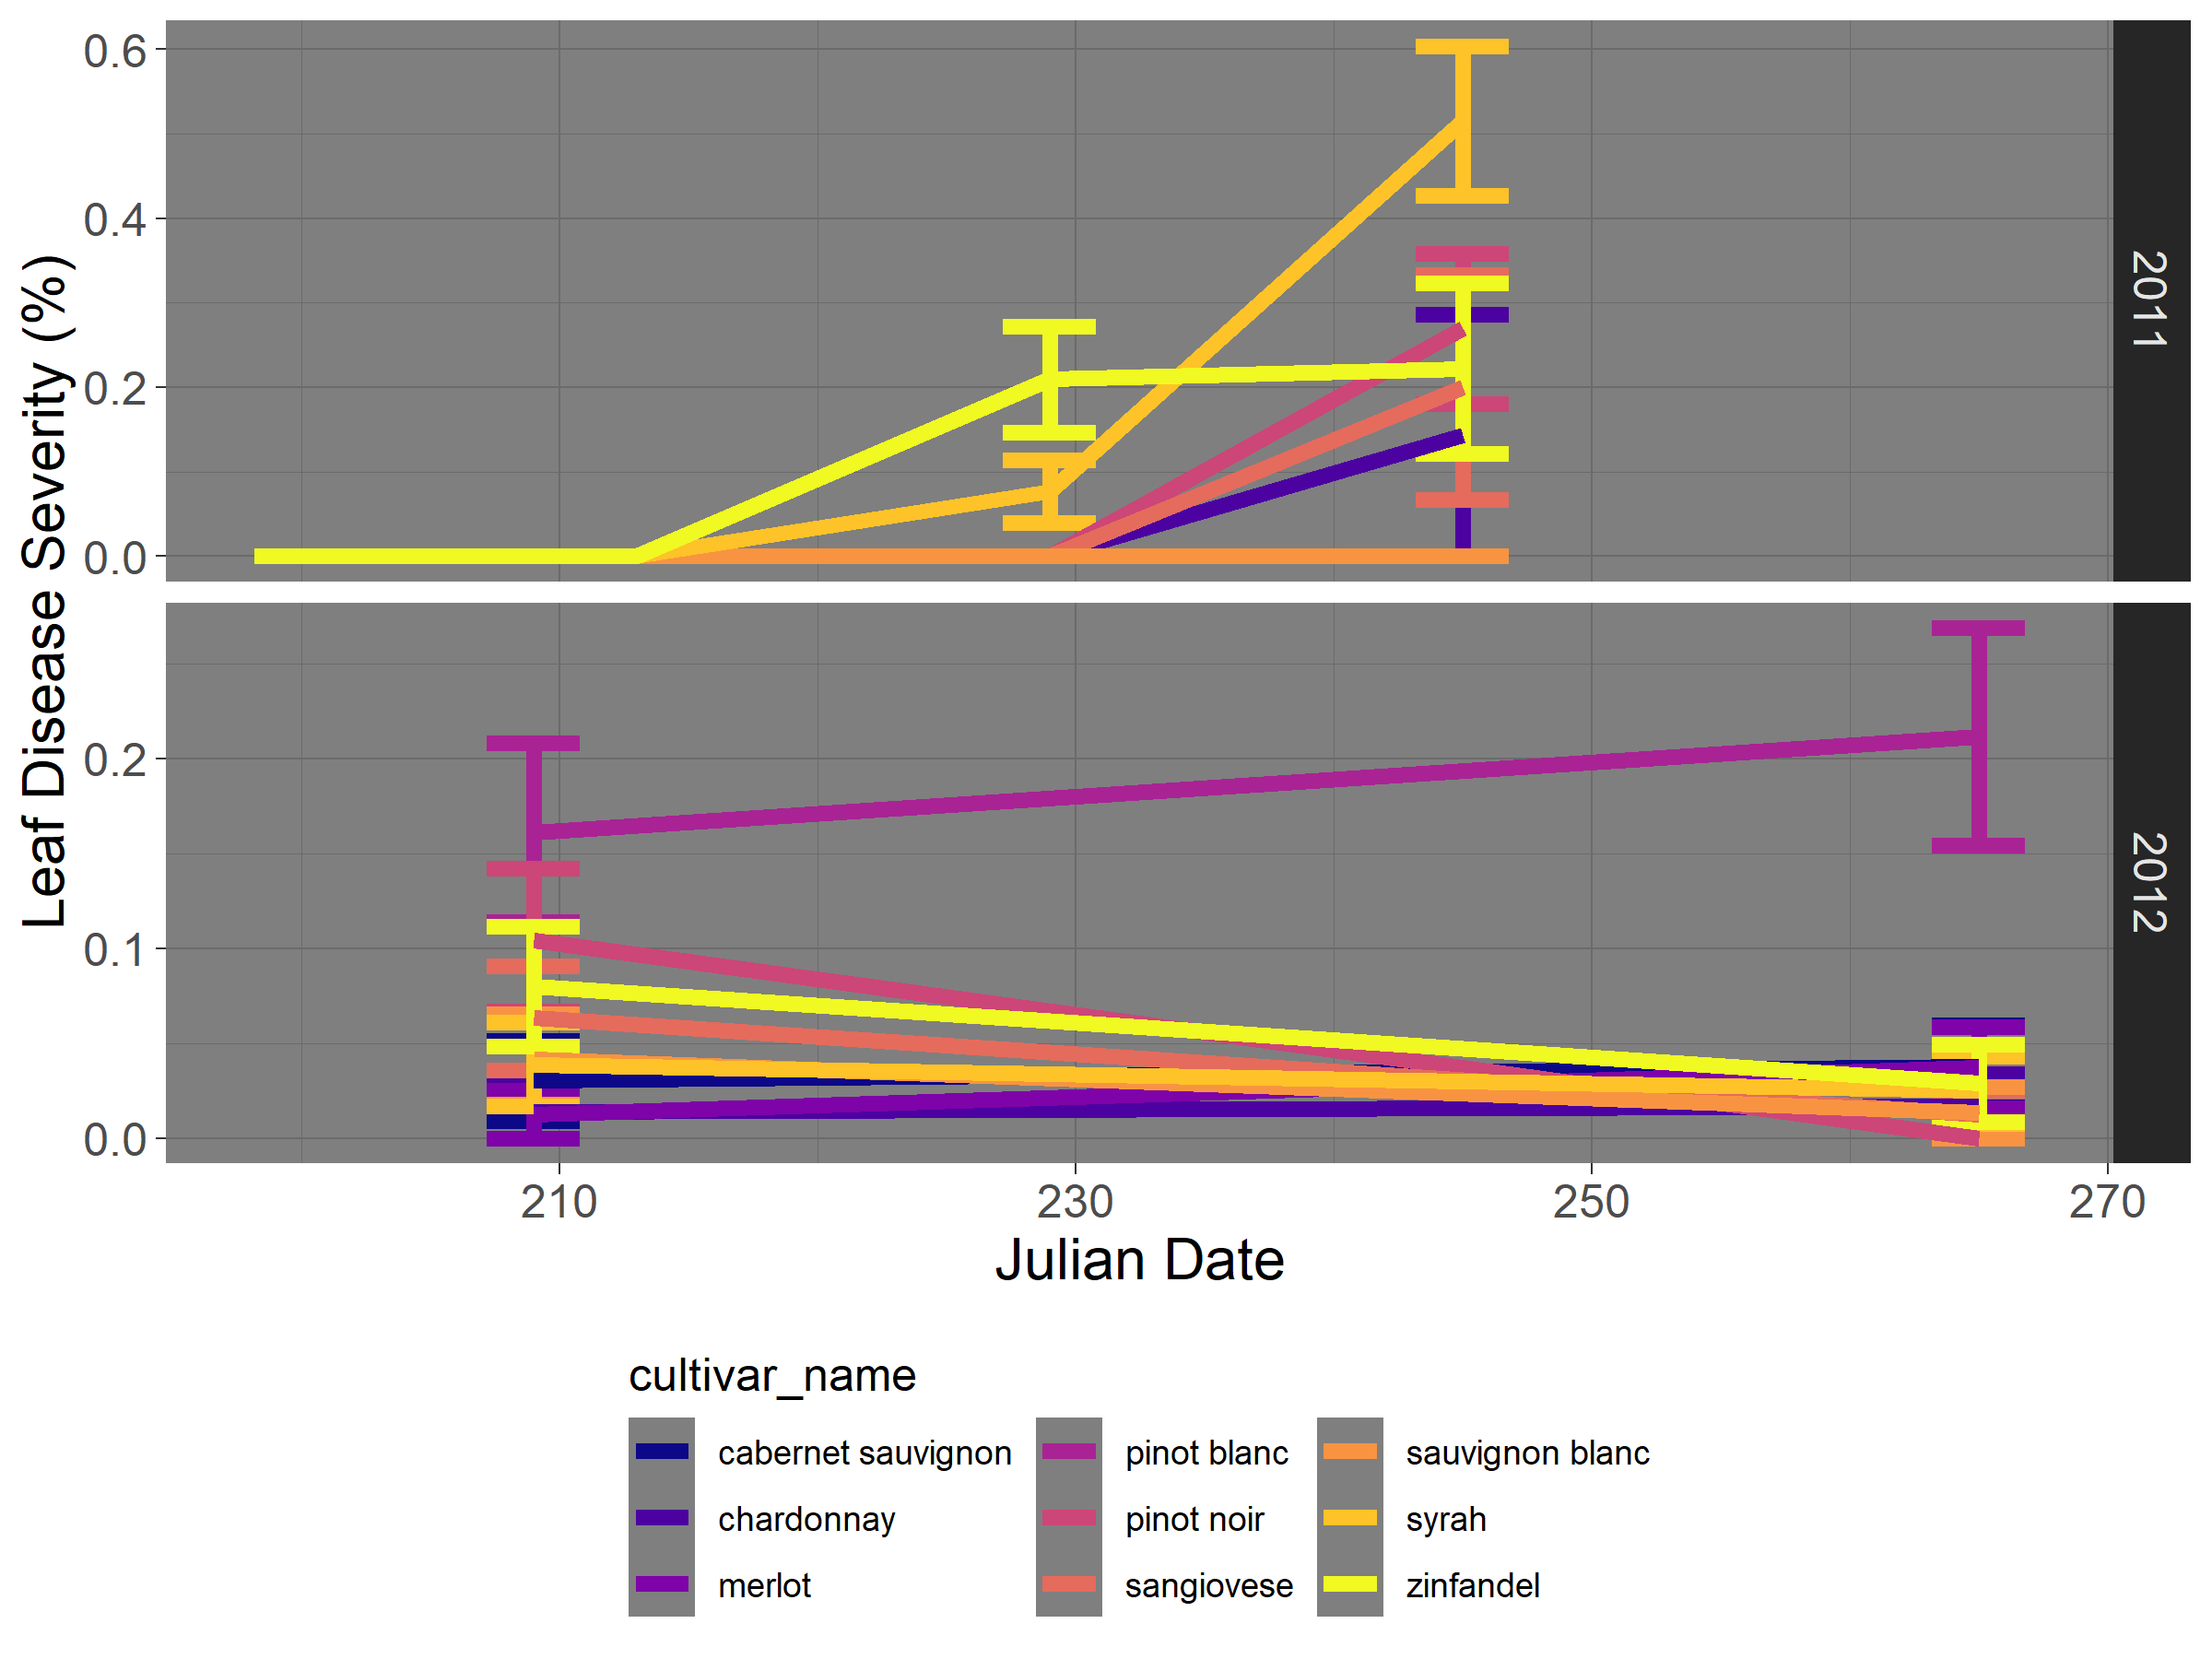 Sauvignon Blanc seemed to be most affected in 2011, although Zinfandel and Pinot Noir were also pretty heavily affected. Pinot Blanc was the most heavily affected cultivar in 2012, so again there is little concordance between the two years.
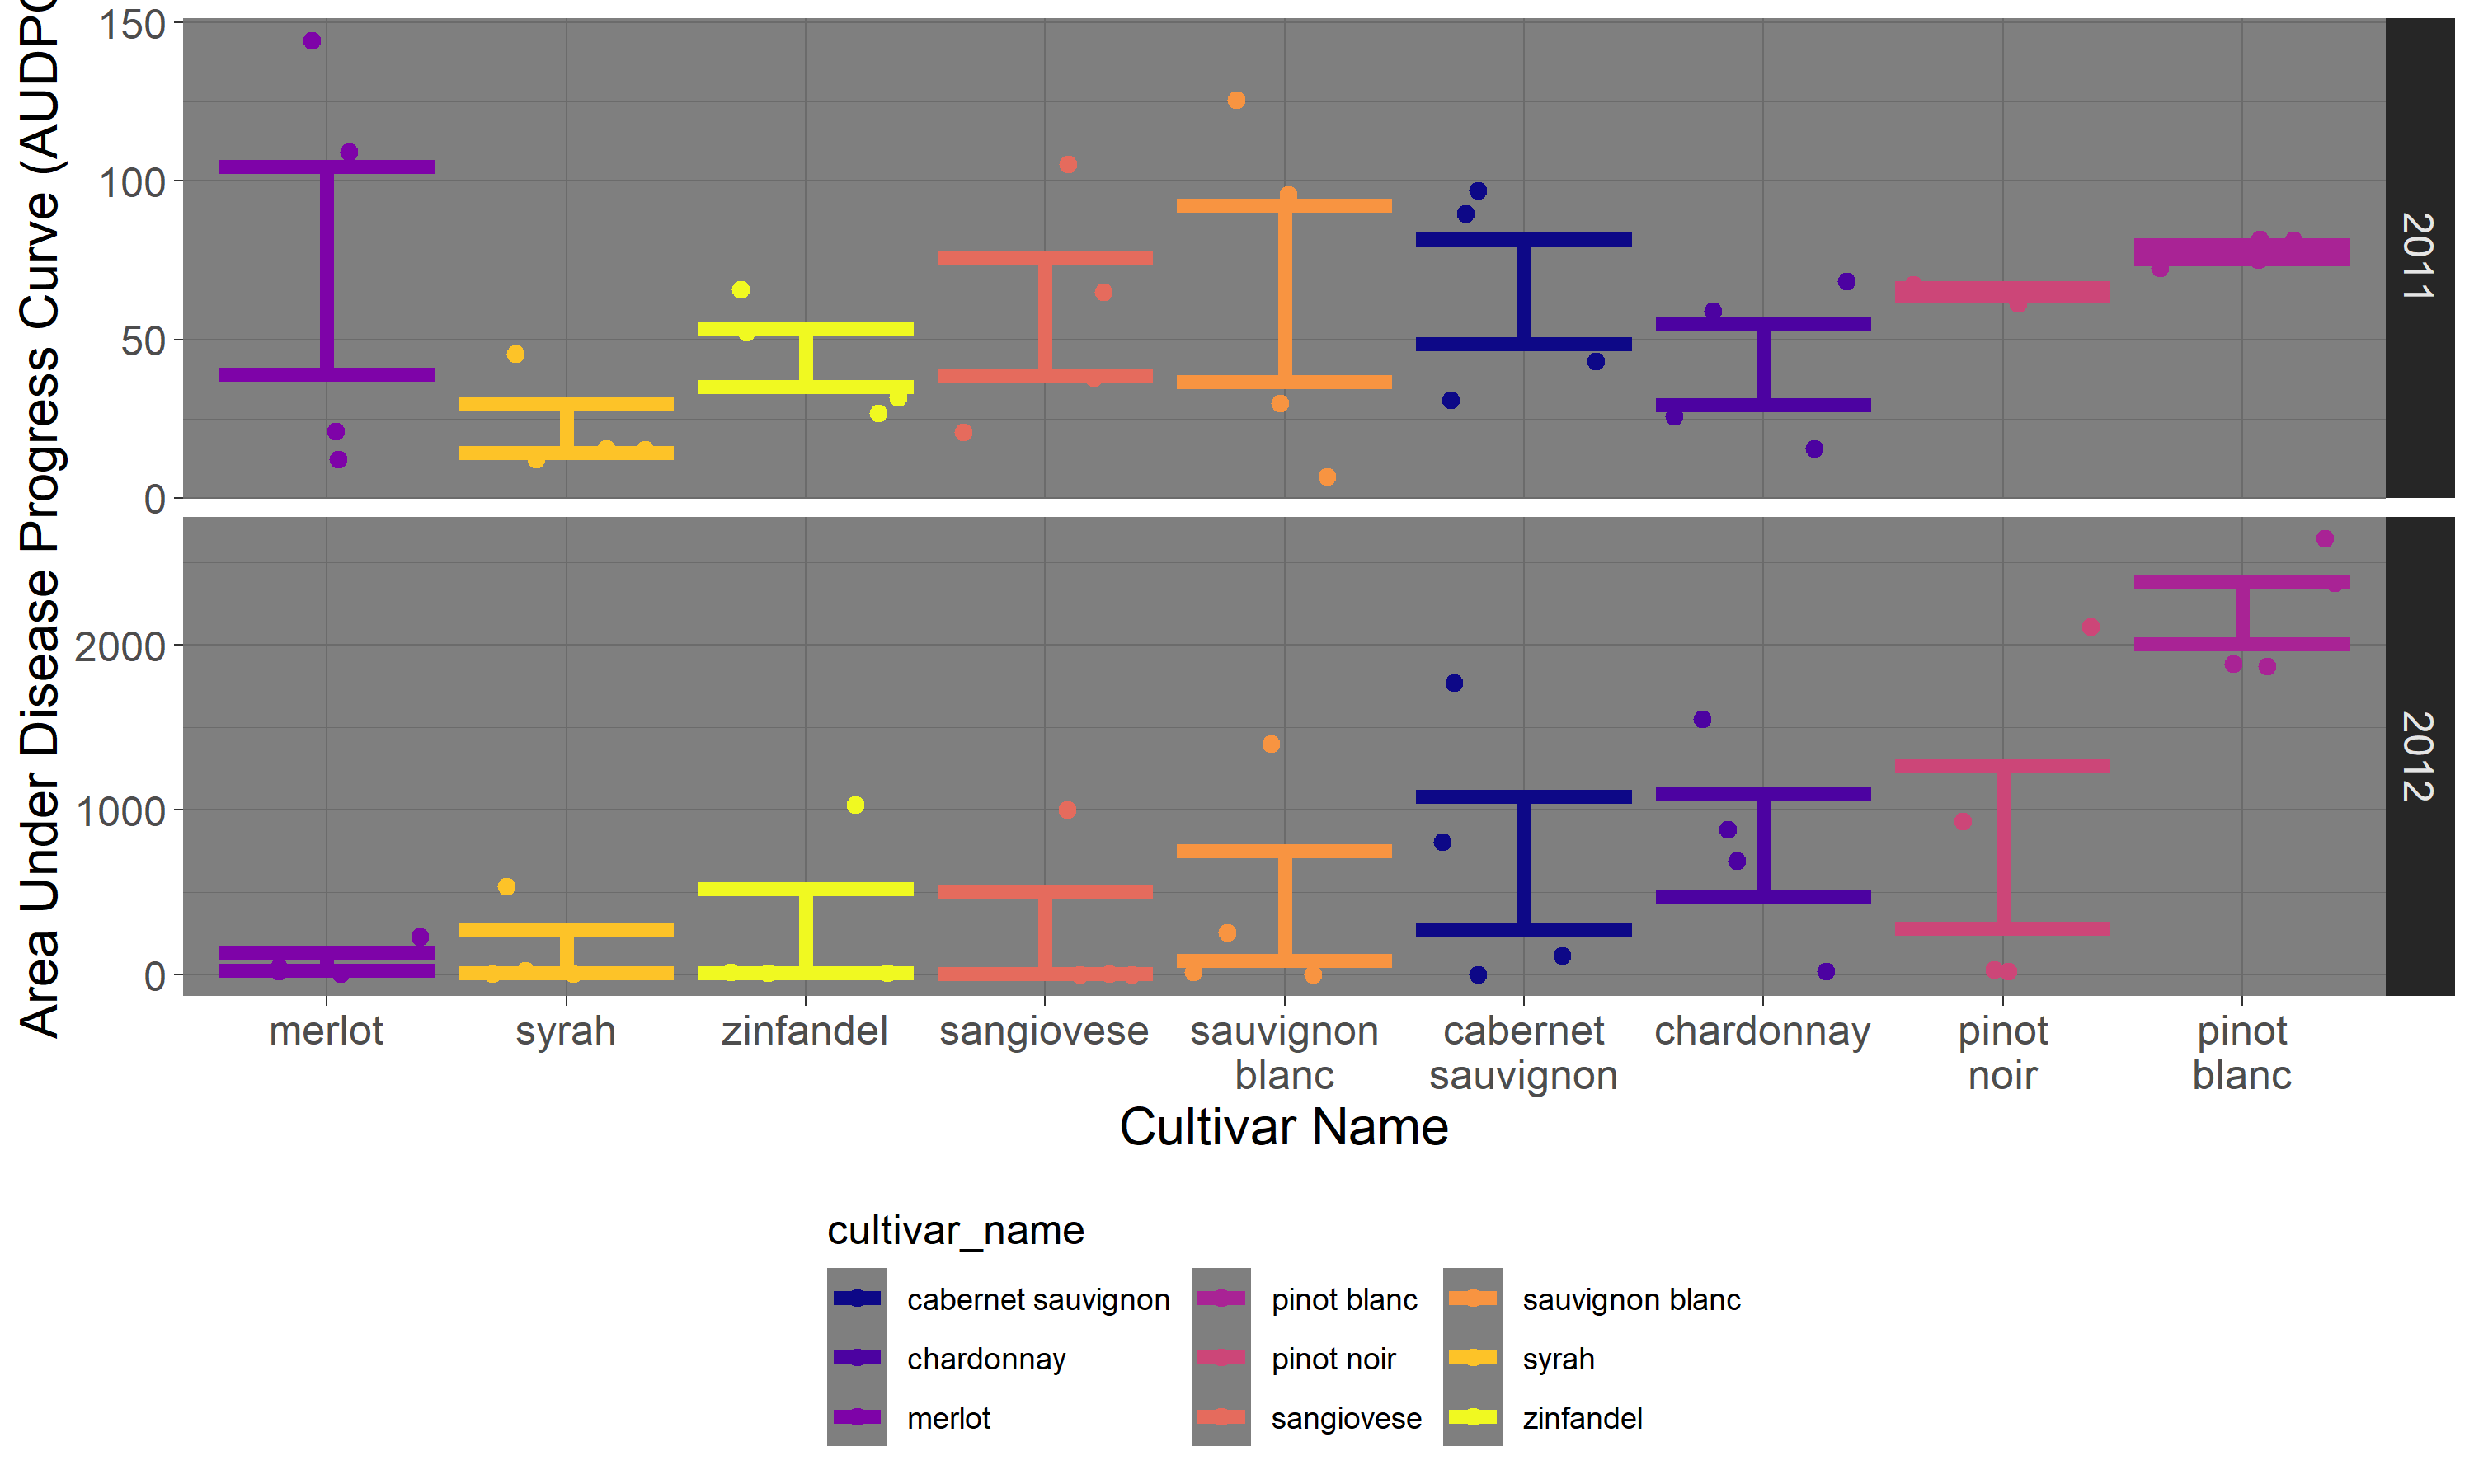 When comparing across years, its sometimes useful to rely on a more holistic metric, like the area under the disease progress curve (AUDPC). We looked at AUDPC for leaves and found decent concordance between the two years, suggesting that Syrah is less heavily affected than many other cultivars (and is very tasty, to boot!).
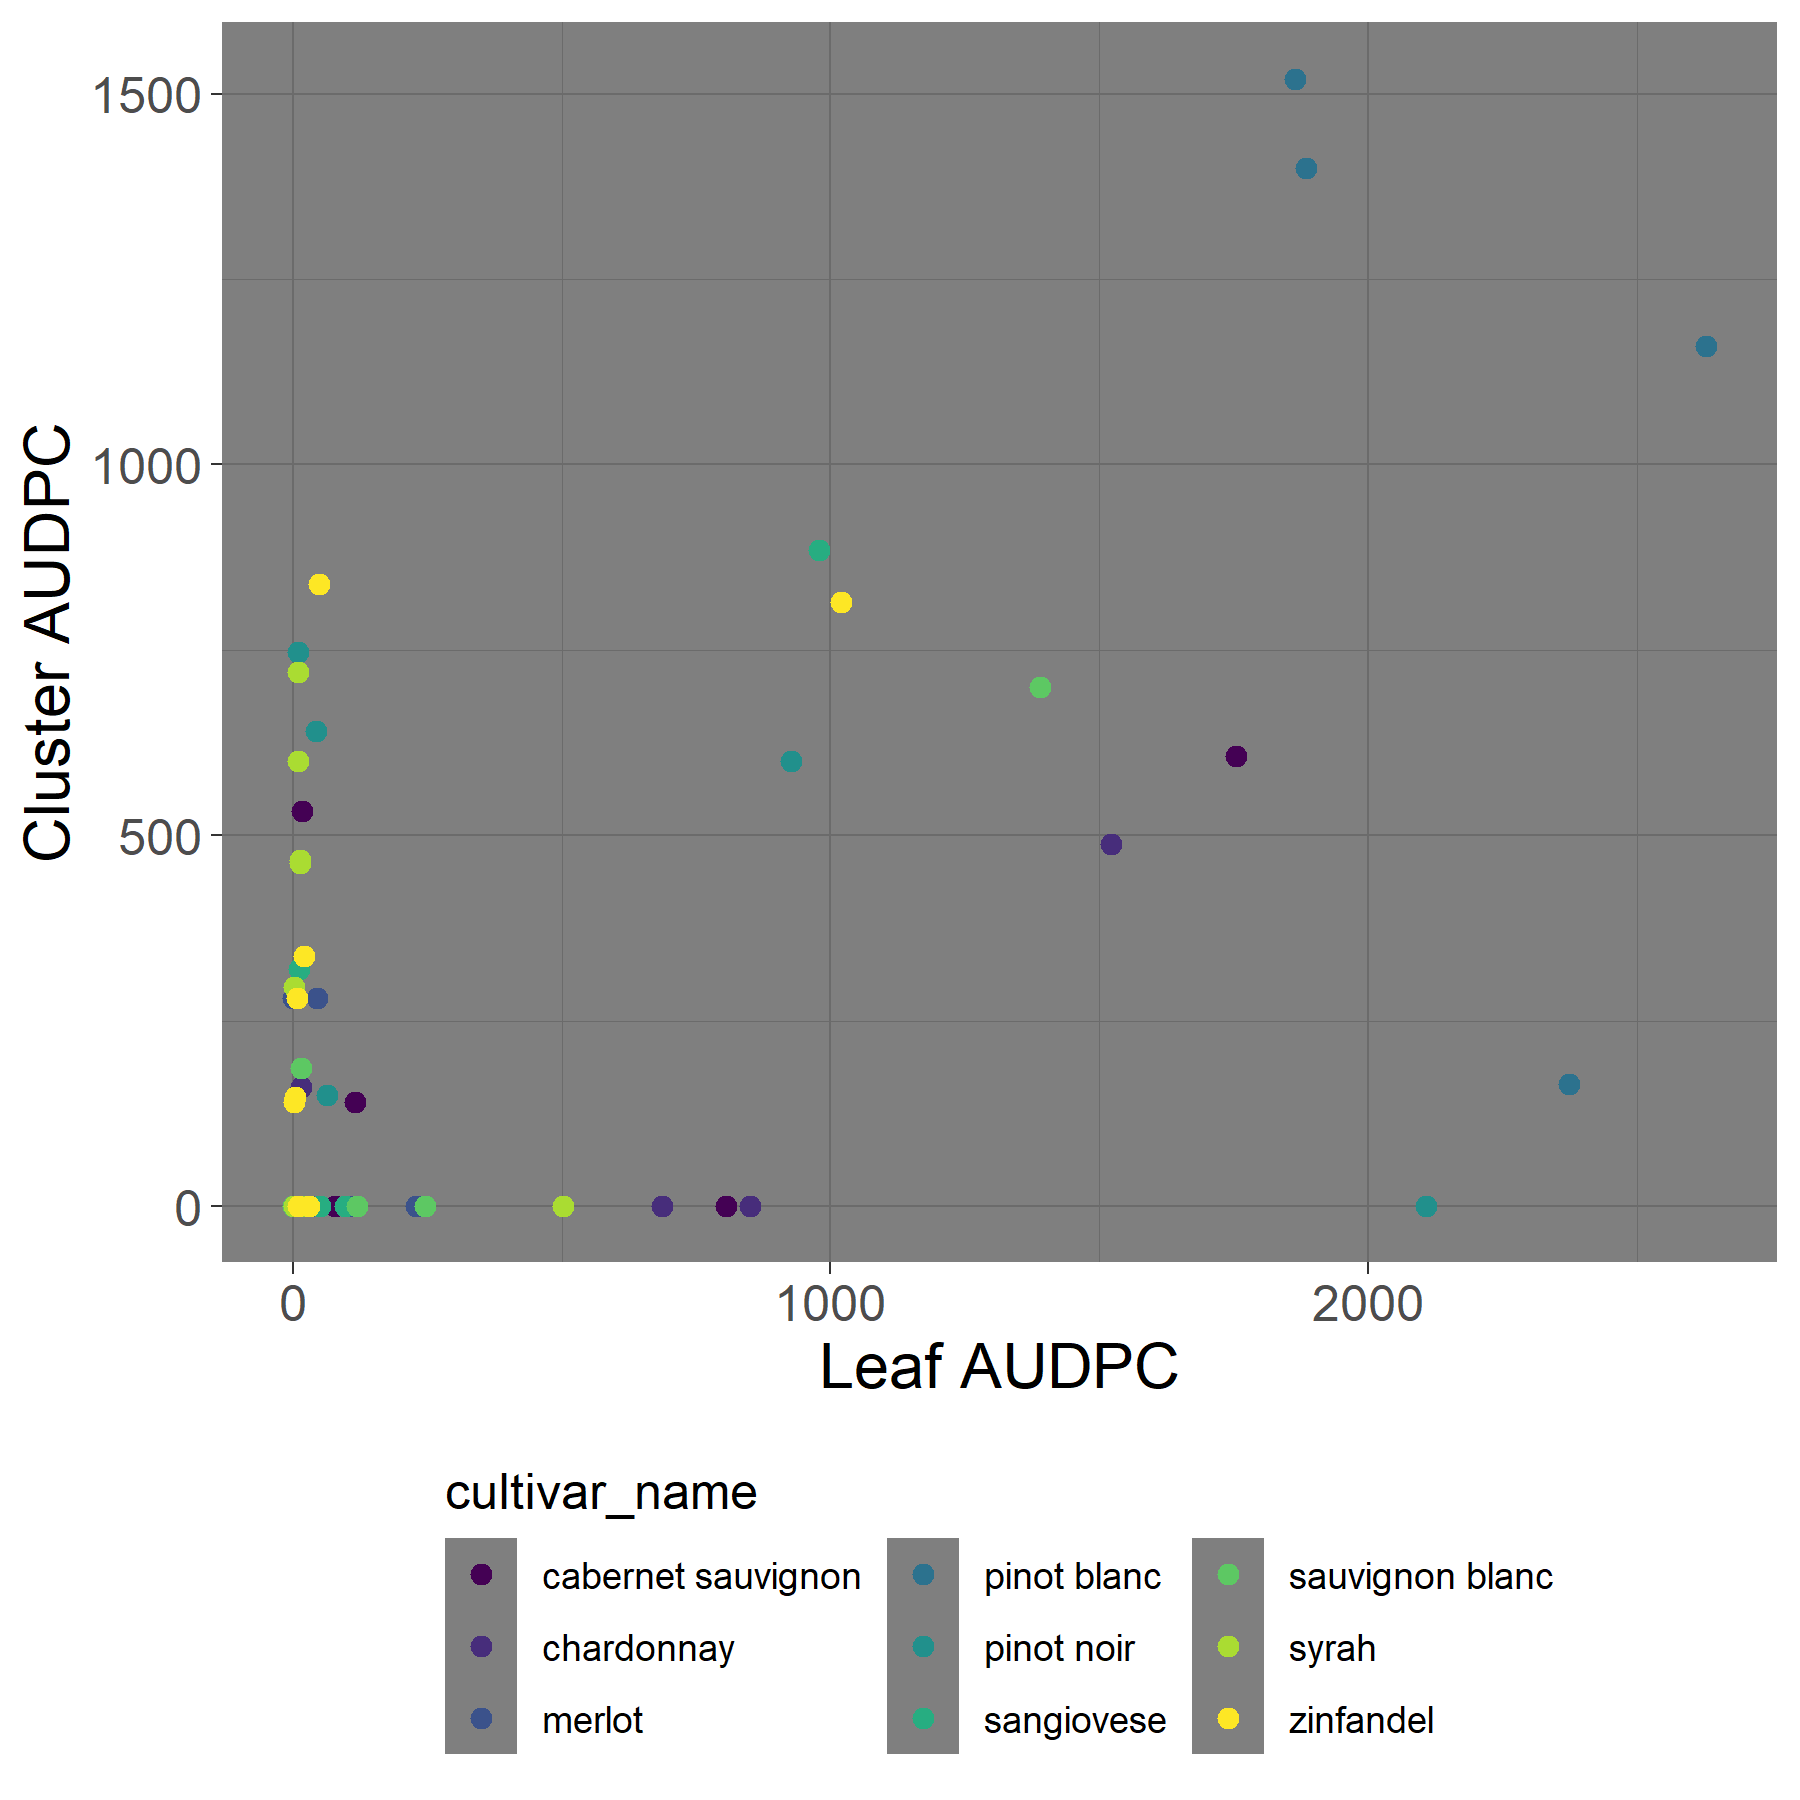 When looking at AUDPC ratings for clusters and leaves of different varieties, we can see that some varieties are more heavily affected in the clusters rather than the leaves. This has major implications for assaying for disease susceptibility. We frequently use proxies to measure disease severity: in this case, leaves are more abundant and available (basically) year-round. But using leaves alone to measure disease susceptibility could lead to some over- or under-estimations of how resistant a variety will be.
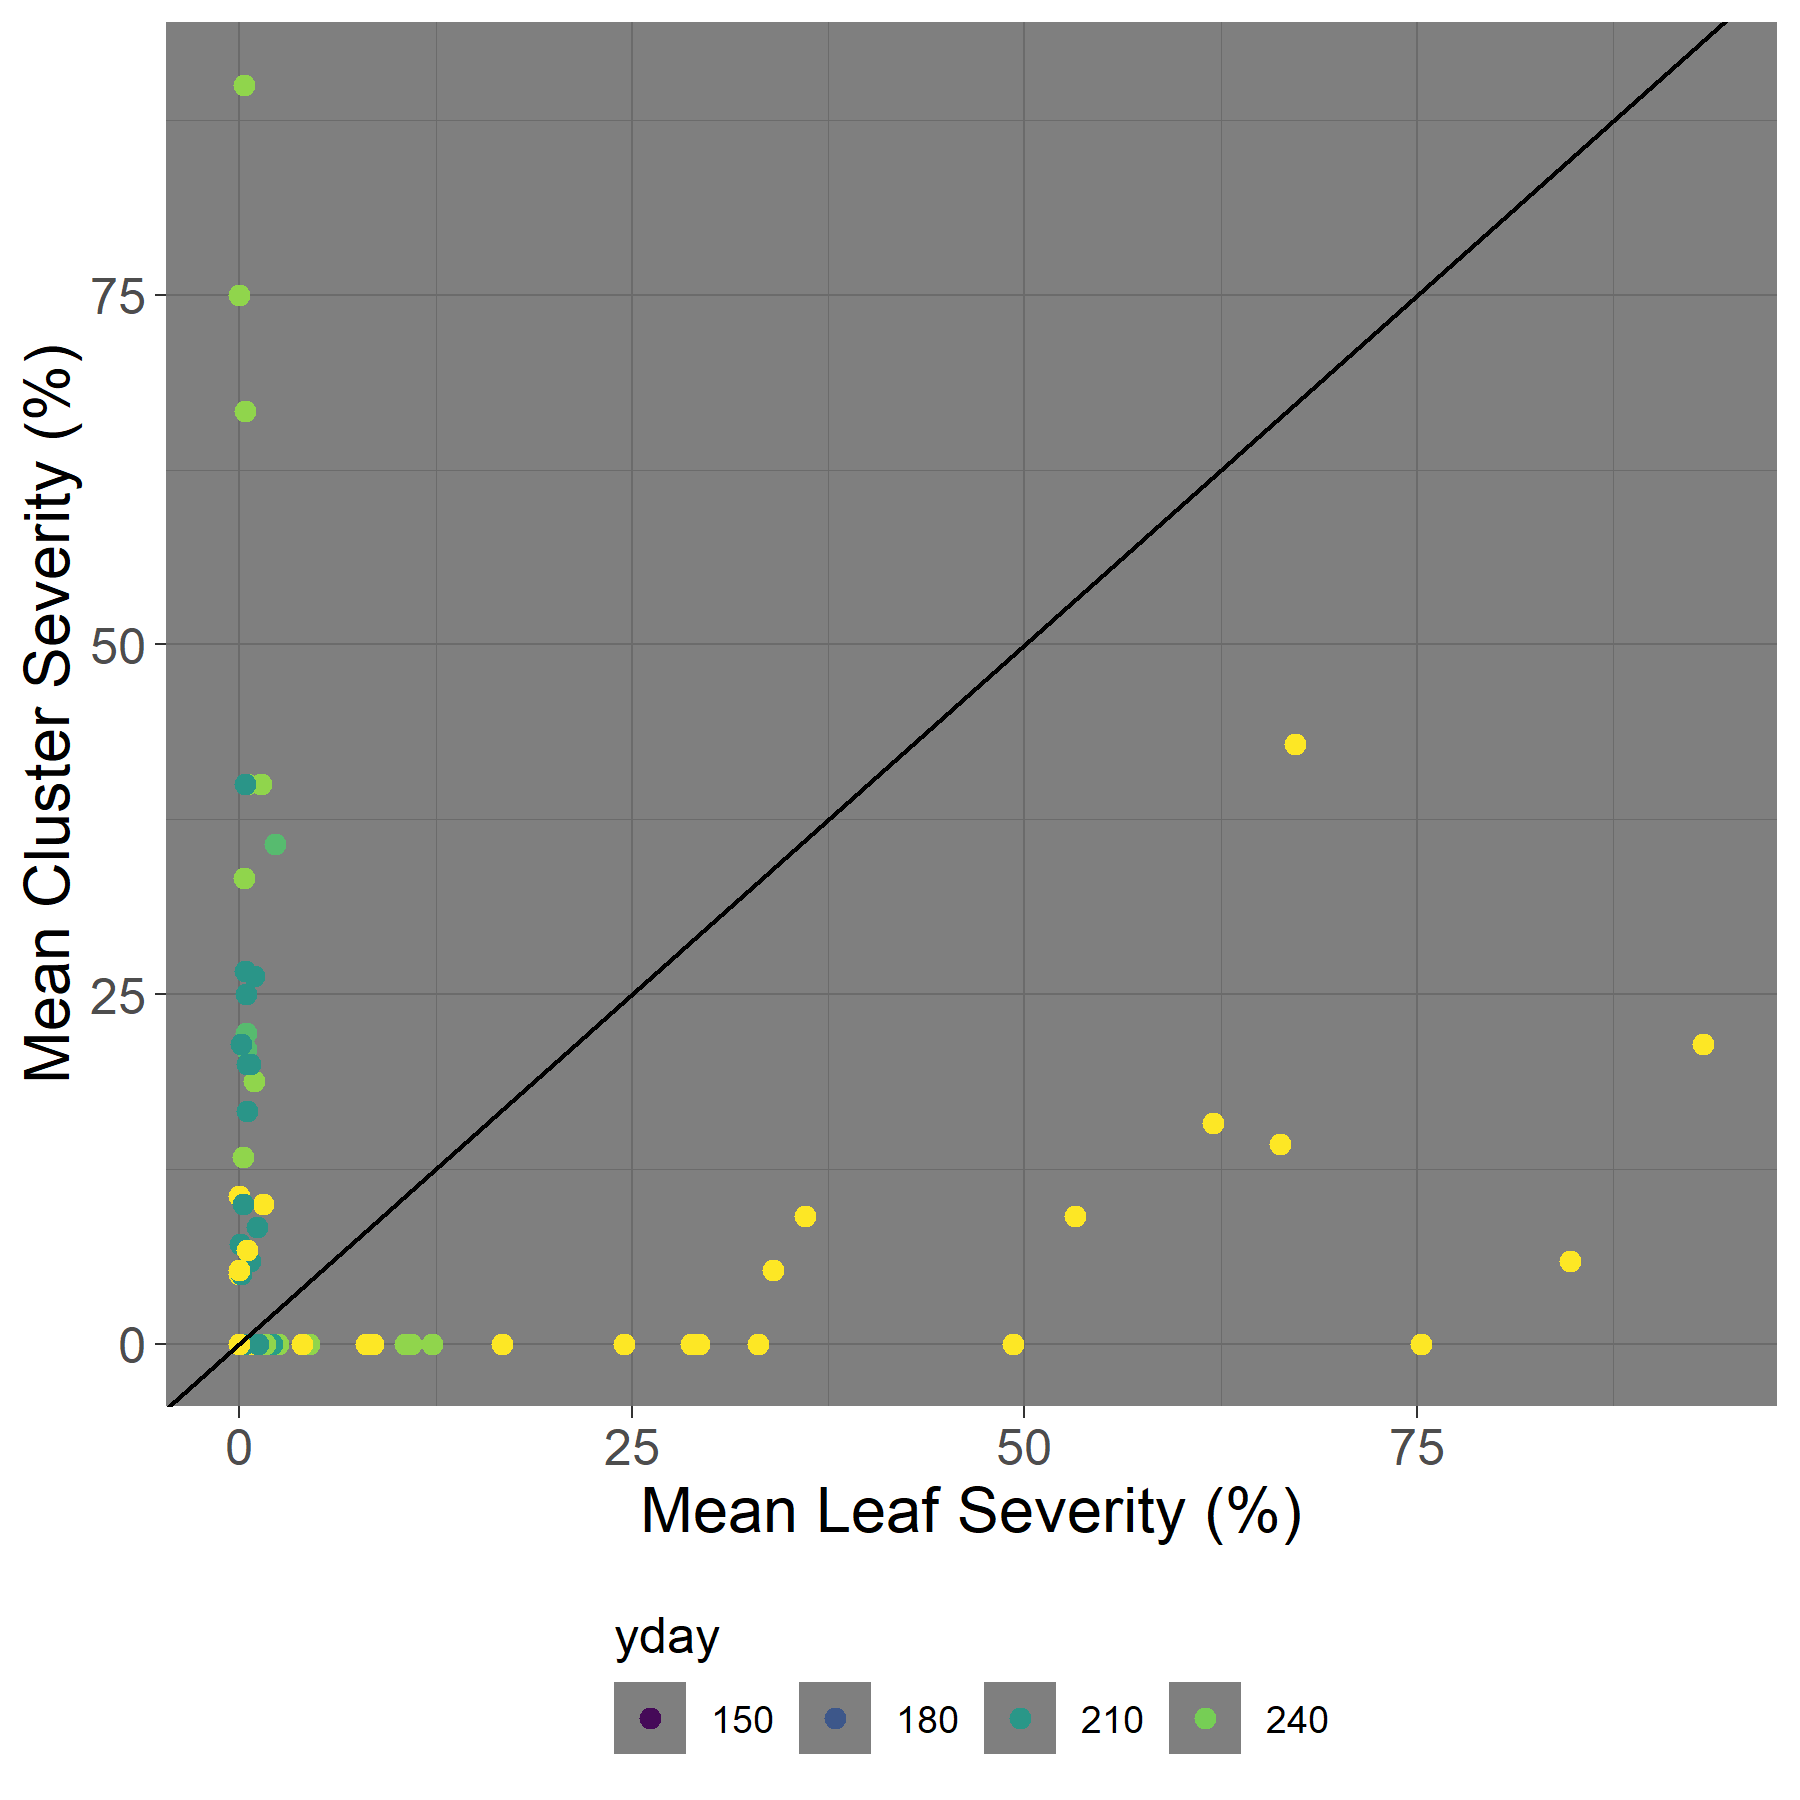 When we plot how disease stacked up for leaves and clusters over time, we can see that they don’t really concur for the cultivars (a perfect concordance would follow the 1:1 line). Part of this is that leaves are more heavily affected early in the season, as seen in the chart.
Conclusions
We found a lot of cool stuff about varieties that are commonly grown in California, but unfortunately the year to year variation in the data made it hard to combine the datasets. I still think that they’re rich datasets, and I probably haven’t explored them to their fullest.